A start with IBM’s Data Science course.
- by Michael A
A while ago I started down the path of data science. I knew a little about what data science was and how it is used(I learned a few things at the university during my time at the physics department), but I never understood how a data scientist came up with the nice graphs and calculations.
Well after a month of Coursera and IBM’s Data science course I managed to do a handful of data science projects and actually have something I can show for.
In one of the courses projects I analyzed the Toronto area for a place where I could open a Japanese restaurant. (The project can be found here https://github.com/illuminati13468/Coursera_capstone)
The project shows in short steps that there are real life possibilities in using the FourSquare API to analyse venues in a city in order to come up with a business plan to for examples, open a restaurant. I found it very fun to be able to analyze the different types of data that could be extracted from the API.
First off I started with reading a json file which contained the data for boroughs, latitude, longitude and neighborhoods.:
This gives some solid information on location of each borough, neighborhood and their names. After this I wanted to get a view of how many neighborhoods we have in each borough:

This would give me an idea of the size of each borough. After this I want to find out how many restaurants we have in each neighborhood, so we combine these data with the venues from FourSquare API to get this:

With this we now have and idea of where the restaurants are located and can now start to pinpoint them to each borough:

Looks like Downtown Toronto has a great deal of Japanese restaurants, which isn’t that surprising since it’s the central business with lots of competition. We also take a look at 6 neighborhoods to see how the restaurants are divided.

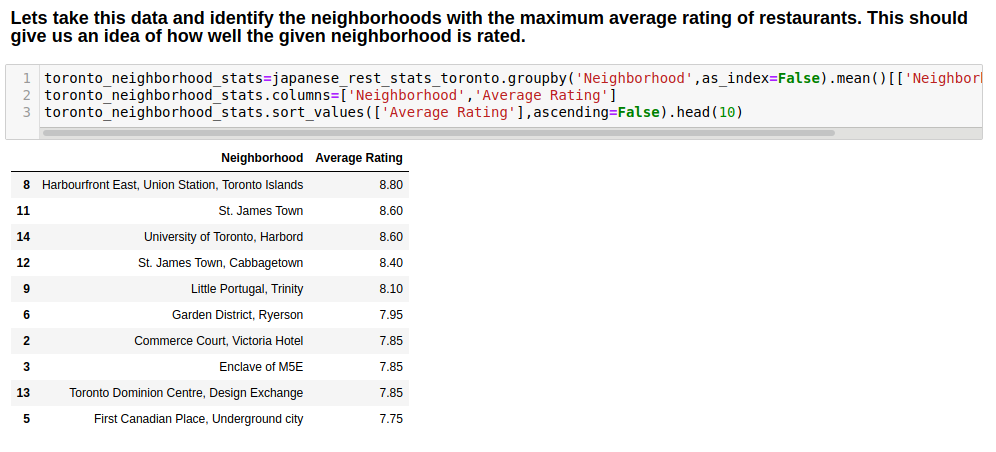
So we have an idea of how many restaurants there are in each neighborhood. Now we want to look at the neighborhoods with the maximum average rating of restaurants so as to determine where we should expect high quality and where to expect low quality.

Another useful rating would be to look at the average on Borough level
West Toronto seems to have the highest average rating of all boroughs, and North York seem to have the lowest. However the reason we don’t stop here and just use West Toronto is because we only have 1 restaurant in West Toronto, so the data for that location is somewhat inconclusive
We are interested in high ratings for the restaurants so we set the average rating to be at least 8.0 and get the following data.

So we have 1 Borough with 5 neighborhoods which have ratings of 8.0 or above. This would also make some sense since this is downtown where business is at it’s highest. The restaurants want to perform above average and businesses that buy from them would surely want the best for their customers and stakeholders.
So there it is. If you want to setup a Japanese restaurant in Toronto, North York might be a good option since you have few good competitors, but Downtown Toronto is where the Elite is at. Choose wisely..
The challenges I faced during the course and the projects we’re mainly the coding part. I usually understand the problem, and what steps needs to be taken to get a result, I just don’t always ‘know’ what to write down. I somehow ended up in some writers block, which was very frustrating to me and I spent many weeks just staring at the screen trying to come up with something. At some point in those weeks I started seeing some patterns in the code and slowly but surely I clipped code together from course notes and what I wrote myself. And suddenly I had some working code. It was an amazing feeling.
Some of the bad feelings that came up for me we’re:
Imposter syndrome
Lack of motivation
Hopelessness
However not all we’re bad and some of the good, which in the end outweighed the bad we’re:
Pride
Joy
Happiness
The ones in bold we’re particular intense. Imposter syndrome came real quick, because I didn’t feel like I knew anything or deserved to pride myself in what I had done, which of course is wrong since I did work hard and I did come up with the solutions needed to get my good grades. The joy and happiness came right after I finished my work, when I see my results.
Please understand that the course is no picnic if you have a 9-5 work, children, and a lovely wife to spend time with as well, however if you have more time, then I am sure you can do better than I did.
One of the things I learned besides the data science tools is how much data there really is about well.. anything.. FourSquare does an excellent job on finding venues data for this particular task but you can also get data from kaggle.com which has a very large list of data sheets ranging from DMV to computer games. Maybe my next project should come from a kaggle data sheet, who knows!?
A while ago I started down the path of data science. I knew a little about what data science was and how it is used(I learned a few things at the university during my time at the physics department), but I never understood how a data scientist came up with the nice graphs and calculations.…
